// TEND FOR SENIORS · ARTICLE 02
Five lines, five years.
What moved in American senior care between 2020 and 2025 — and why navigating all five lines at once is the work TEND is built for.
Every system has a few lines that, taken together, describe what it is becoming. American senior care has five. Each line moves at a different velocity, for a different reason, and squeezes a different part of the same building. From 2020 to 2025, every one of those lines went up — but not in the same direction at the same time, and never with a single source watching all five.
At HE 360, our data analytics arm, we pulled the public records: NIC MAP transaction data, the Federal Reserve's rate history, BLS wage and CPI series, KFF's 50-state Medicaid surveys, CMS regulatory reports. We indexed each line to 2020 and laid them next to each other. The picture that emerges is the macro reality every senior, family, operator, and investor is actually living inside.
This is the article that lays out the five lines. The article after this one shows what TEND does inside that picture.
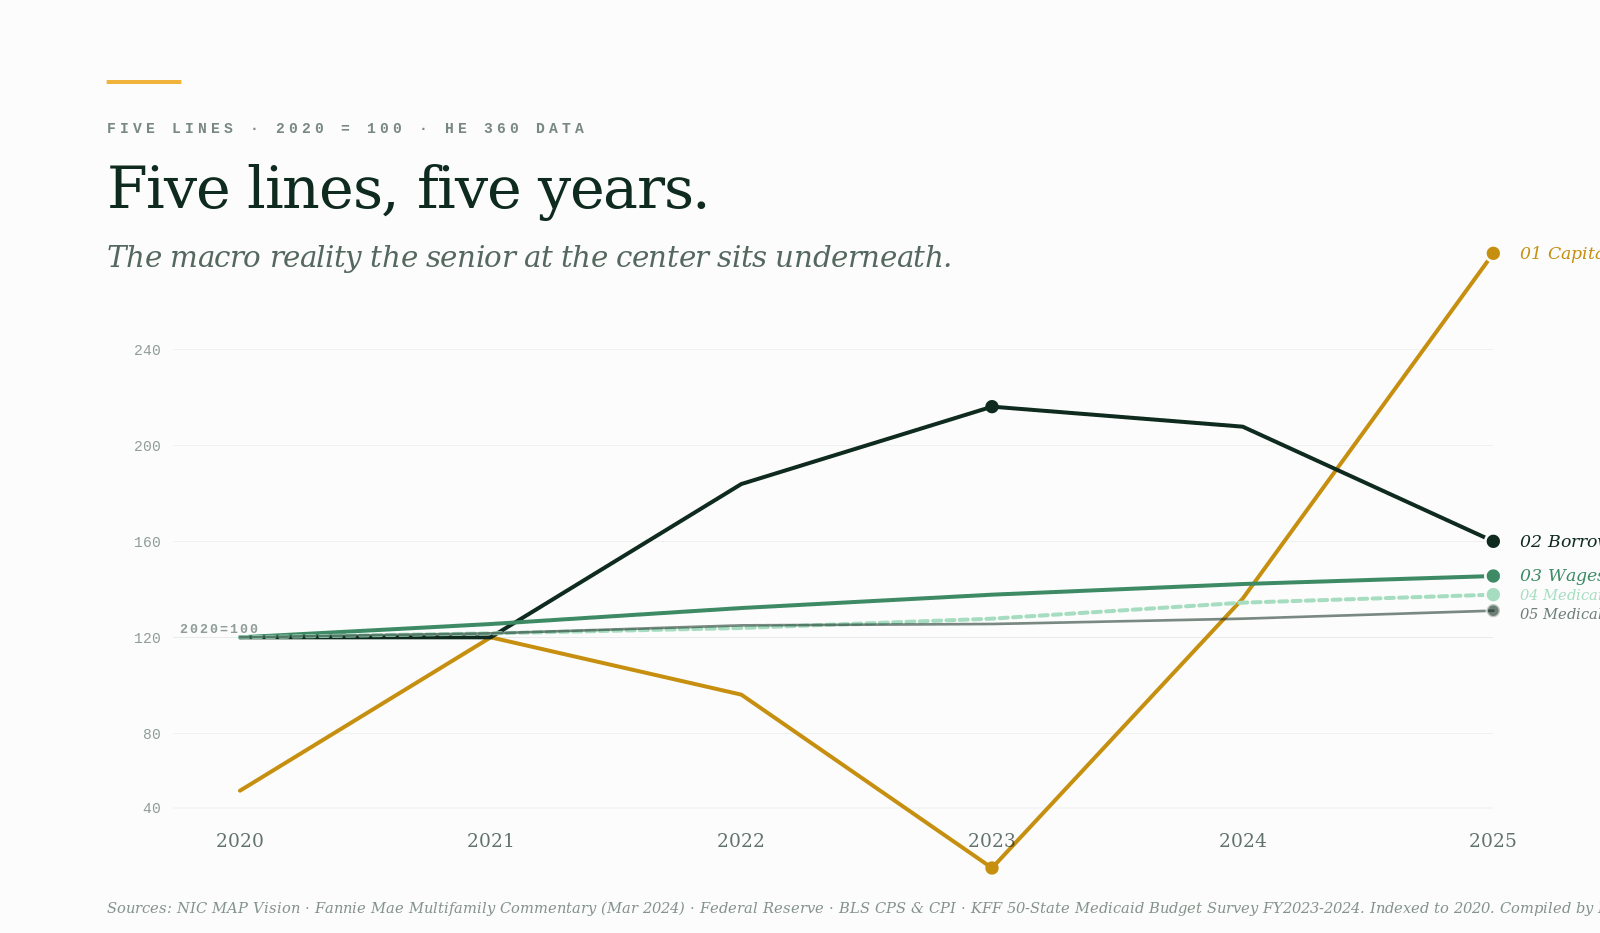
To visualize how these forces diverged between 2020 and 2025, HE360 indexed each line to a 2020 baseline:
| The vector | 5-year trajectory & velocity | Primary pressure point |
|---|---|---|
| 01 Capital | Volatile crash to $111K/unit (2023), roaring rebound past $180K/unit (2025). | Transaction volume & valuations |
| 02 Borrowing | Sub-1% target spiked to 5.50%, then eased back to 3.75% by late 2025. | Cost of debt & refinancing math |
| 03 Wages | Relentless 28–30% nominal increase; turnover stuck at a brutal 42–44%. | Frontline staffing & daily operations |
| 04 Medicaid | Complete fragmentation; flat state updates pivoted to localized 4% to 98% hikes. | Regional compliance & revenue mix |
| 05 Medical inputs | Quiet, compounded 13–14% growth matching general consumer inflation. | Care delivery line-items & margins |
Sources: NIC MAP Vision · Fannie Mae Multifamily Commentary (Mar 2024) · Federal Reserve · BLS CPS & CPI · KFF 50-State Medicaid Budget Survey FY2023-2024. Indexed to 2020. Compiled by HE 360.
01 · CAPITALSenior housing prices crashed in 2023, then recovered hard.
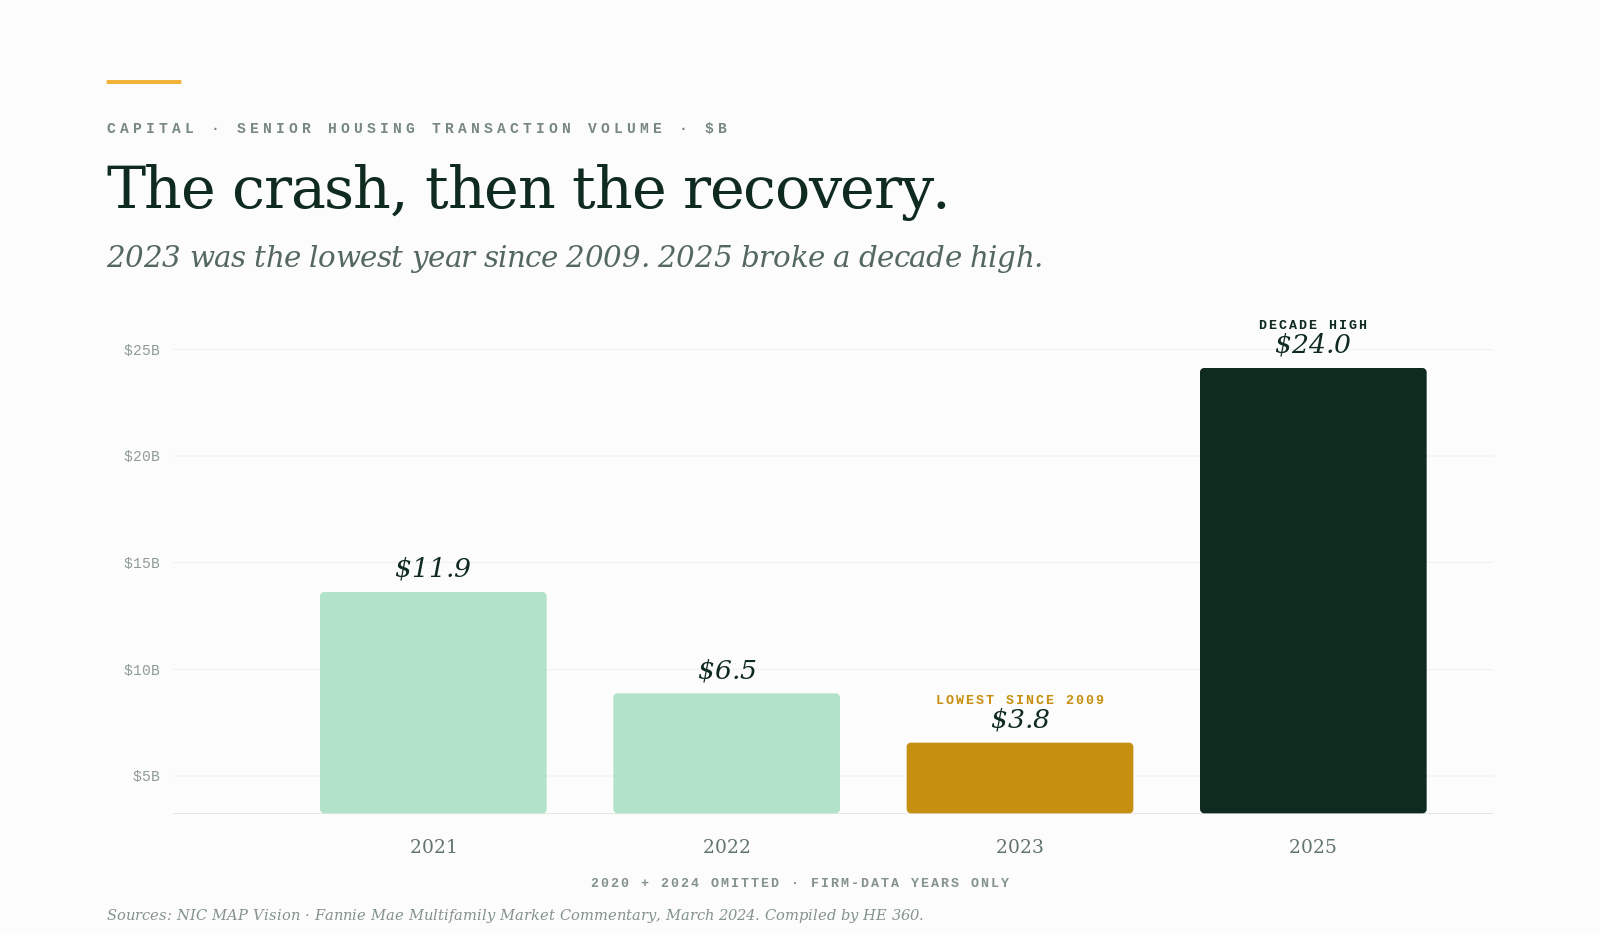
The most volatile line of the five belongs to the investors. Senior housing transaction volume hit roughly $11.9 billion in 2021. By 2023, it had collapsed to $3.8 billion — the lowest level since 2009. The average price per unit fell from roughly $180,000 in 2022 to $111,868 in 2023, a 38% drop in a single year. The cause was not demand, which kept climbing as the population aged. The cause was the cost of money: rates rose so fast that the math on every senior housing acquisition stopped working in the 18 months between the pandemic recovery and the hike cycle's peak.
Then it came back. By the third quarter of 2025, the rolling four-quarter price per unit had recovered to roughly $175,000 and continued past $180,000 by year-end — up 43% year over year, and ahead of the longer-term pre-pandemic norm. Total annual transaction volume returned to a decade high of around $24 billion.
Sources: NIC MAP Vision · Fannie Mae Multifamily Market Commentary, March 2024. Compiled by HE 360. (2020 + 2024 omitted; firm-data years only.)
This is the line that gets the trade-press headlines: capital is back. It is also the line that obscures the other four.
02 · BORROWINGThe cost of money roughly doubled, then started easing.
The Federal Reserve's target rate sat at 0.25% through 2020 and 2021. By the end of 2023, the upper target had reached 5.50% — a 525-basis-point move in 24 months, the fastest tightening cycle in 40 years. Through 2024, the Fed cut by 100 basis points across three meetings (a 50-bp cut in September and 25-bp cuts in November and December), ending 2024 at 4.50%. After three additional 25-basis-point cuts in September, October, and December 2025, the upper target ended 2025 at 3.75%.
For an operator borrowing to acquire or refinance a senior living community, the practical translation was direct: a new commercial mortgage that priced at roughly 4.0–4.5% in 2020 priced at roughly 6.5–7.5% in 2024, with the peak in 2023 closer to 8%. The interest cost on a typical financing roughly doubled, then began easing. Existing portfolios with long-dated locked-in mortgages were partially insulated. New deals and refinancings were not.
This is the line that determined whether 2023's senior housing transaction crash happened. Capital did not disappear. The price of capital changed, and the math underneath every deal had to be rebuilt.
03 · WAGESFrontline pay rose roughly 30%, and turnover stayed near 44%.
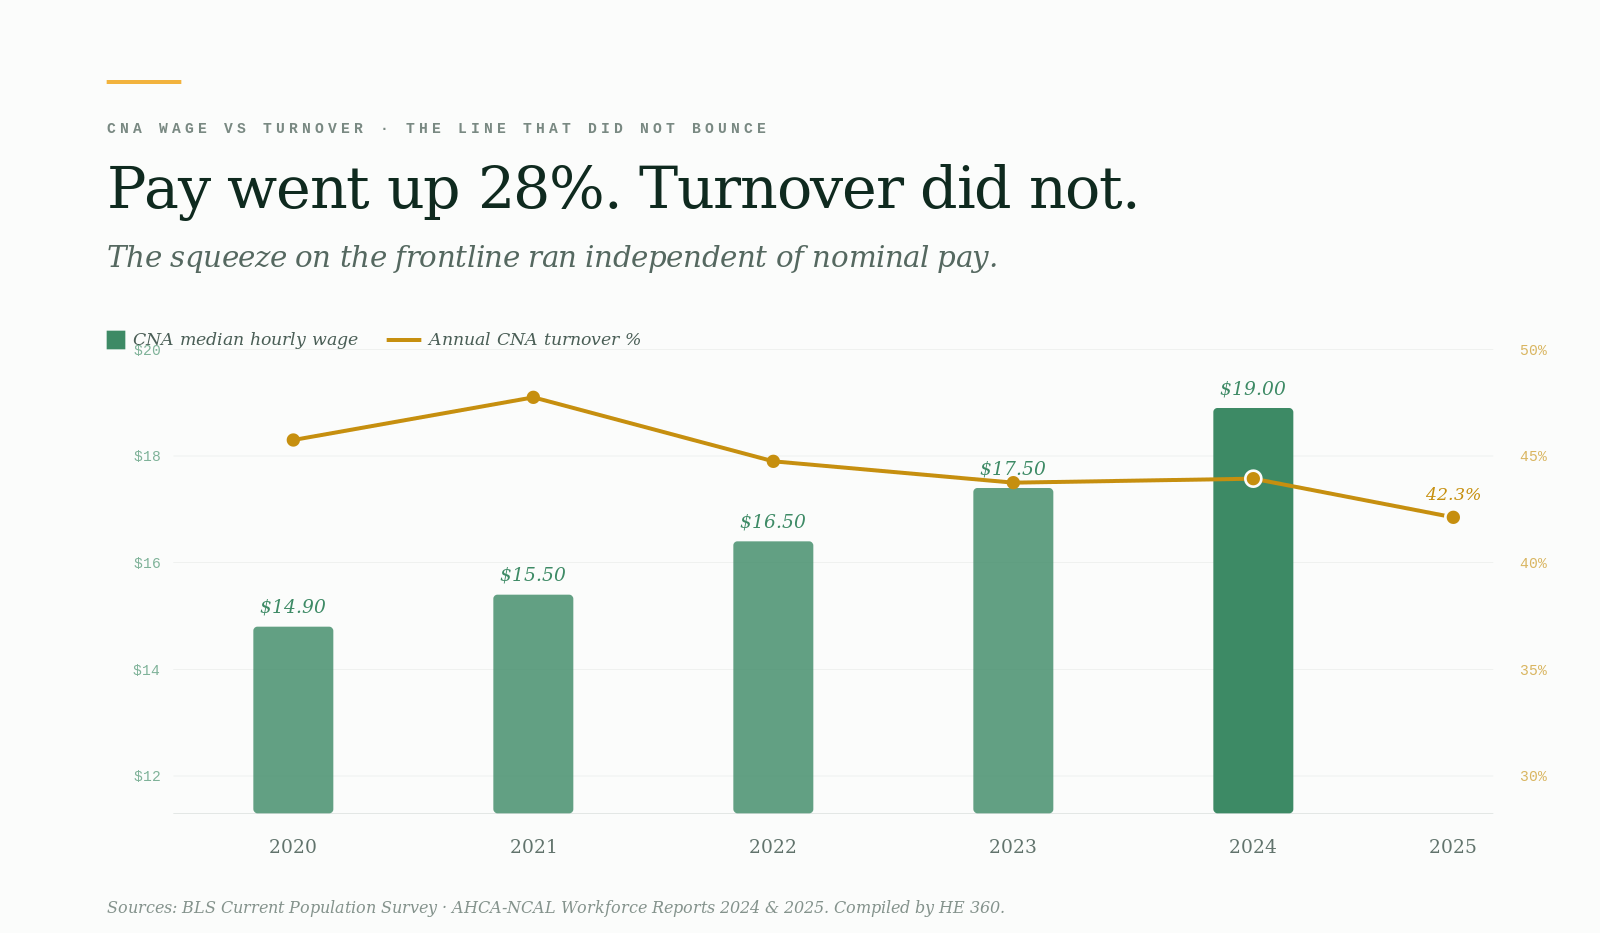
The line that compounded most relentlessly belongs to the staff. The BLS median hourly wage for nursing assistants rose from approximately $14.90 in May 2020 to $19.00 in May 2024 — a 28% nominal increase in four years, or roughly 12% in real, inflation-adjusted terms. The pressure came from multiple directions at once: pandemic-era hazard pay that became baseline expectations, state minimum-wage increases, competition with retail and hospitality employers, and a chronic shortage of certified nursing assistants the industry has been unable to close.
Even with the raises, turnover stayed brutal.
// THE 2024–2025 WORKFORCE REALITY
CNA annual turnover: 44.16% (2024) → 42.34% (2025)
The squeeze: 94% of nursing homes and 81% of assisted living communities enter 2026 facing chronic staffing shortages.
Sources: BLS Current Population Survey · AHCA-NCAL Workforce Reports 2024 & 2025. Compiled by HE 360.
This is the line operators talk about every week. It is the line that did not bounce. It is the line that, in many buildings, determined whether a resident's care plan got delivered that morning.
04 · MEDICAIDPublic reimbursements moved — one state at a time, very unevenly.
Federal Medicaid does not pay for room and board in assisted living. Each state runs its own Home and Community-Based Services waiver program, with its own reimbursement rates, its own update cycles, and its own legislative cadence. So the fourth line is not really a single line at all. It is fifty.
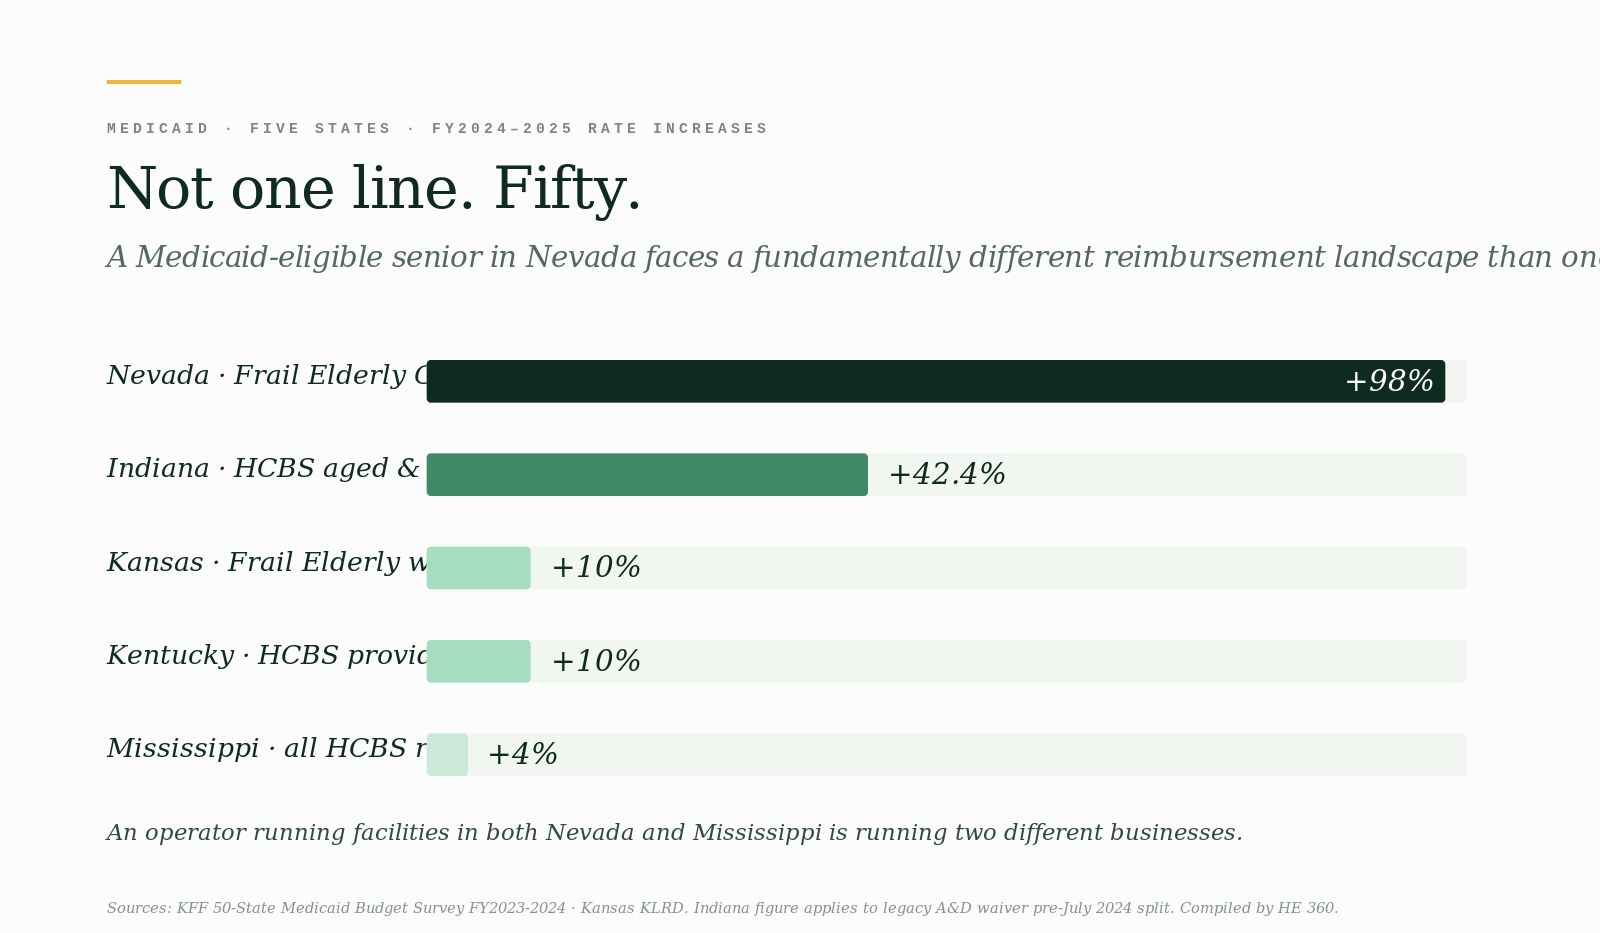
Through 2020 and 2021, most state HCBS rates moved slowly or held flat. Beginning in 2023 and accelerating into 2024, the pattern shifted. KFF's 50-state Medicaid survey for fiscal years 2024 and 2025 captured the variance:
- Indiana raised HCBS waiver rates for aged and disabled services by 42.4%.
- Nevada raised its Frail Elderly Group Care (ALF) sub-rate by an average of 98%.
- Kansas raised the Frail Elderly waiver by 10% for fiscal 2024.
- Kentucky implemented a legislatively mandated 10% HCBS provider rate increase.
- Mississippi raised all HCBS rates by 4%.
Sources: KFF 50-State Medicaid Budget Survey FY2023-2024 · Kansas KLRD. Indiana figure applies to legacy A&D waiver pre-July 2024 split into PathWays + Health and Wellness. Compiled by HE 360.
The result is that a Medicaid-eligible senior in Nevada faces a fundamentally different reimbursement landscape than one in Mississippi, and an operator who runs facilities in both states is running two different businesses. There is no single national Medicaid rate trajectory. There are fifty parallel ones.
05 · MEDICAL INPUTSThe cost of care itself compounded around 13–14% over five years.
The fifth line is the one that gets the least attention because it moves the most quietly. The BLS Medical Care Consumer Price Index ran at roughly +4.0% in 2020, +1.6% in 2021, +4.0% in 2022, +0.7% in 2023, and +2.6% in 2024. Compounded across the period, the medical inputs that go into a senior's daily care — medications, durable medical equipment, incontinence supplies, wound care, dietary inputs, clinical services — cost roughly 13–14% more in 2025 than they did in 2020.
Thirteen to fourteen percent over five years is well below the rate at which frontline wages rose (28%) and well below the rate at which top-state Medicaid rates rose (some states 40%+), but it is roughly in line with general consumer inflation over the same period. And it lands on a population that is already medically complex: more than four in ten assisted living residents have dementia, more than eight in ten have three or more chronic conditions, and more than six in ten are on multiple medications.
This is the line that the resident feels most directly — in the bottle on the nightstand, in the box in the closet, in the bill that arrives every month with a line item that was not there last quarter.
06 · THE COMPOSITEFive lines, one building, no single hand on the wheel.
Set the five lines next to each other and the picture is not the one the trade headlines tell. Capital crashed and came back. Borrowing doubled and started easing. Wages compounded relentlessly. Medicaid moved state by state in fifty different directions. Medical inputs ground higher quietly.
No single source watches all five. The investor reads NIC. The operator reads AHCA-NCAL. The regulator reads CMS. The family reads Genworth. The policy analyst reads KFF. Each is honest. Each is partial. The senior at the center sits underneath every one of them and is the only person living inside all five at once.
This is the structural problem with American senior care today. The system has five interconnected pressure points, each measured by a different institution, each acted on by a different professional cohort, and none of them collected into one decision surface for the people who have to make the decisions: the senior, the family, the operator, and the investor.
07 · WHAT TEND DOESThe visibility layer across all five lines.
TEND is not a placement marketplace. TEND is not a lead-gen service. TEND is the network layer organized around the senior, built so that the family making the decision, the operator running the building, and the investor allocating capital can all see the same five lines at once — per community, per state, per quarter.
FAMILY SIDE
Find Home. Vetted communities by state, care tier, and budget. Published base rates, typical care-level surcharges, historical escalation, Medicaid status, and the 5-year runway, per community.
FAMILY SIDE
Care Clearance. Physician-signed senior care admission forms in 24 hours, rolling out state by state — the form that holds up admissions today, closed in a day.
FAMILY SIDE
Tend Home. A TEND-branded family portal that works at any enrolled community. One place for updates, medications, meals, visits, and concerns.
COMMUNITY SIDE
We Assist with Medications. eMAR, pharmacy coordination, audit trail. Compliance documentation that travels with the resident.
COMMUNITY SIDE
We Run Virtual Care + Front Desk. Resident assessments, care plans, staffing coordination, food service, activities — the operations layer delivered with consistency, particularly inside the squeeze line 03 describes.
UNDER BOTH
HE 360. The data backbone that produced this article. Tracks all five lines per community, per state, per quarter. Publishes the picture nobody else assembles.
The architectural choice underneath all of this is the one Article 01 named: every TEND service maps to a specific number that families, operators, and investors should already be seeing — and rarely are. The five lines are the macro version of the same proposition. The visibility layer is the work.
08 · THE INVITATIONAcross the country, state by state. Summer 2026.
For families
If you are navigating senior care now, or expect to within the year, the waitlist is open in all 50 states. You will be notified the day Care Clearance and Find Home open in yours.
For communities
If you operate an assisted living or memory care community and you want to be on the network that publishes the picture above, partner with us.
For investors and policy
If you allocate capital into senior care, or work in senior care policy or analytics, the cross-state outcomes data layer we are building will matter to how you read the next decade. Let's have the conversation.